Drools Debugging - rules engine - drools tutorial - business rules engine
What is Debugging?
- Debugging, in computer programming and engineering, is a multistep process that involves identifying a problem, isolating the source of the problem, and then either correcting the problem or determining a way to work around it.
- The final step of debugging is to test the correction or workaround and make sure it works.
- There are Various method to debug a Drools project. In this, we will write a Utility class to know which rules are being triggered or fired.
- With this line, you can see what all rules are getting triggered in your Drools project. Here is our Utility Class

learn drools tutorial - drools project - drools debugging - drools example programs
Utility.java
package com.sample;

import org.drools.spi.KnowledgeHelper;

public class Utility {
   public static void help(final KnowledgeHelper drools, final String message){
      System.out.println(message);
      System.out.println("\nrule triggered: " + drools.getRule().getName());
   }

   public static void helper(final KnowledgeHelper drools){
      System.out.println("\nrule triggered: " + drools.getRule().getName());
   }
}
- The first method help prints the rule triggered along with some extra information which you can pass as String via the DRL file.
- The second rule helper prints whether the specific rule was triggered or not.
- We have added one of the Utility methods in each DRL file.
- We have also added the import function in the DRL file (Lucknow.drl).
- In the then part of the rule, we have added the utility function call.
- The modified Lucknow.drl is given below.
Modified Lucknow.drl
package droolsexample

//list any import classes here.
import com.sample.ItemCity;
import java.math.BigDecimal;
import com.sample.HelloCity;

import function com.sample.Utility.helper;

// declare any global variables here
dialect "java"
rule "Lucknow Medicine Item"

   when
      item : ItemCity(purchaseCity == ItemCity.City.LUCKNOW,
                      typeofItem == ItemCity.Type.MEDICINES)

   then
      BigDecimal tax = new BigDecimal(0.0);
      item.setLocalTax(tax.multiply(item.getSellPrice()));
      HelloCity.writeHello(item.getPurchaseCity().toString());
      helper(drools);
end

rule "Lucknow Gadgets Item"

   when
      item : ItemCity(purchaseCity == ItemCity.City.LUCKNOW,
                      typeofItem == ItemCity.Type.GADGETS)

   then
      BigDecimal tax = new BigDecimal(2.0);
      item.setLocalTax(tax.multiply(item.getSellPrice()));
      helper(drools);
end
- Similarly, we have added the other utility function in the second DRL file (Noida.drl). Here is the modified code:
Modified Noida.drl
package droolsexample

// list any import classes here.
import com.sample.ItemCity;
import java.math.BigDecimal;

import function com.sample.Utility.help;

//declare any global variables here
dialect "java"

rule "Noida Medicine Item"

   when
      item : ItemCity(purchaseCity == ItemCity.City.NOIDA,
                      typeofItem == ItemCity.Type.MEDICINES)

   then
      BigDecimal tax = new BigDecimal(0.0);
      item.setLocalTax(tax.multiply(item.getSellPrice()));
      help(drools,"added info");
end

rule "Noida Gadgets Item"

   when
      item : ItemCity(purchaseCity == ItemCity.City.NOIDA,
                      typeofItem == ItemCity.Type.GADGETS)

   then
      BigDecimal tax = new BigDecimal(1.0);
      item.setLocalTax(tax.multiply(item.getSellPrice()));
      help(drools,"info");
end
Output
info

rule triggered: Noida Gadgets Item
added info

rule triggered: Noida Medicine Item

rule triggered: Lucknow Gadgets Item
HELLO LUCKNOW!!!!!!

rule triggered: Lucknow Medicine Item
LUCKNOW 0
LUCKNOW 20
NOIDA 0
NOIDA 10
- Both the utility functions are called and it shows whether the particular rule was called or not.
- In the above example, all the rules are being called, but in an enterprise application, this utility function can be really useful to debug and find out whether a particular rule was fired or not.
Using the Debug Perspective in Eclipse
- Debug the rules during the execution of your Drools application.
- Add breakpoints in the consequences of your rules, and whenever such a breakpoint is met during the execution of the rules, execution is stopped temporarily.
- Then inspect the variables known at that point as you do in a Java Application, and use the normal debugging options available in Eclipse.
- To create a breakpoint in your DRL file, just double-click at the line where you need to create a breakpoint.
- Remember, you can only create a breakpoint in the then part of a rule.
- A breakpoint can be removed by double-clicking on the breakpoint in the DRL editor.
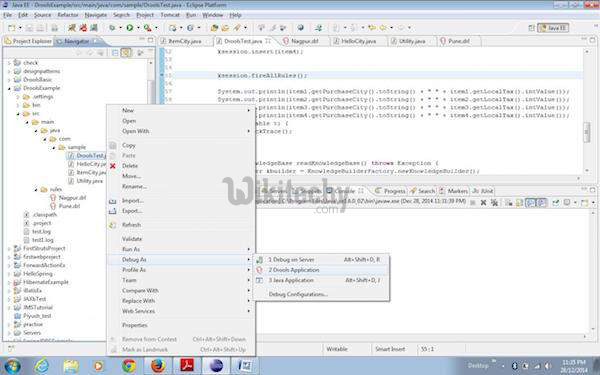
- After applying the breakpoints, you need to debug your application as a Drools application.
- Drools breakpoints (breakpoints in DRL file) will only work if your application is being debugged as a Drools application.

Learn Drools Tutorial - Drools Application - Example
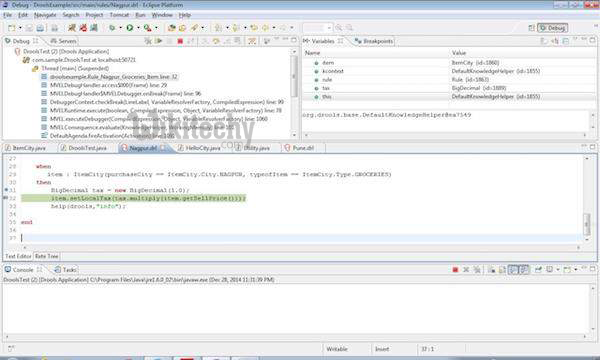
- Once you debug your application as a Drools application, you would see the control on the DRL file as shown in the following screenshot:

Learn Drools Tutorial - Eclipse Platform - Example
- You can see the variables and the current values of the object at that debug point.
- The same control of F6 to move to the next line and F8 to jump to the next debug point are applicable here as well. In this way, you can debug your Drools application.
- Note: The debug perspective in Drools application works only if the dialect is MVEL until Drools 5.x.
