How to use GDB Debugger
How to use GDB Debugger
- GNU or GDB debugger is an application for finding out how your C or C++ program runs or for Analysing the moment the program crashes.
- You can perform many useful tasks with GDB
- Run the program,
- Stop the program under specific conditions,
- Analyse the situation,
- Make modifications, and
- Test new changes.
- GDB stands for GNU Project Debugger and is a powerful debugging tool for C (along with other languages like C++).
- It helps you to push around inside your C programs while they are executing and also allows you to see what exactly happens when your program crashes. GDB operates on executable files which are binary files produced by compilation process.
For demo purpose, below example is executed on a Linux machine with below specs.
- Go to your Linux command prompt and type
“gdb”.
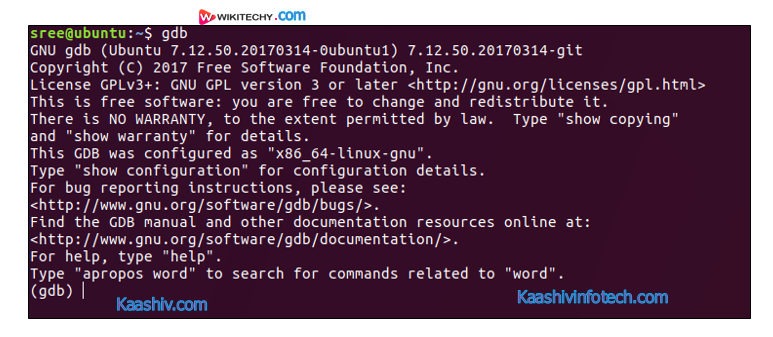
How to Use Gdb Debugger
- GDB command prompt lets you know that it is ready for commands. To exit out of gdb, type
quitorq. - GDB offers many ways to debug and understand your code like examining stack, memory, threads, manipulating the program, etc.